SRA-Seg: Synthetic to Real Alignment for Semi-Supervised Medical Image Segmentation
Abstract
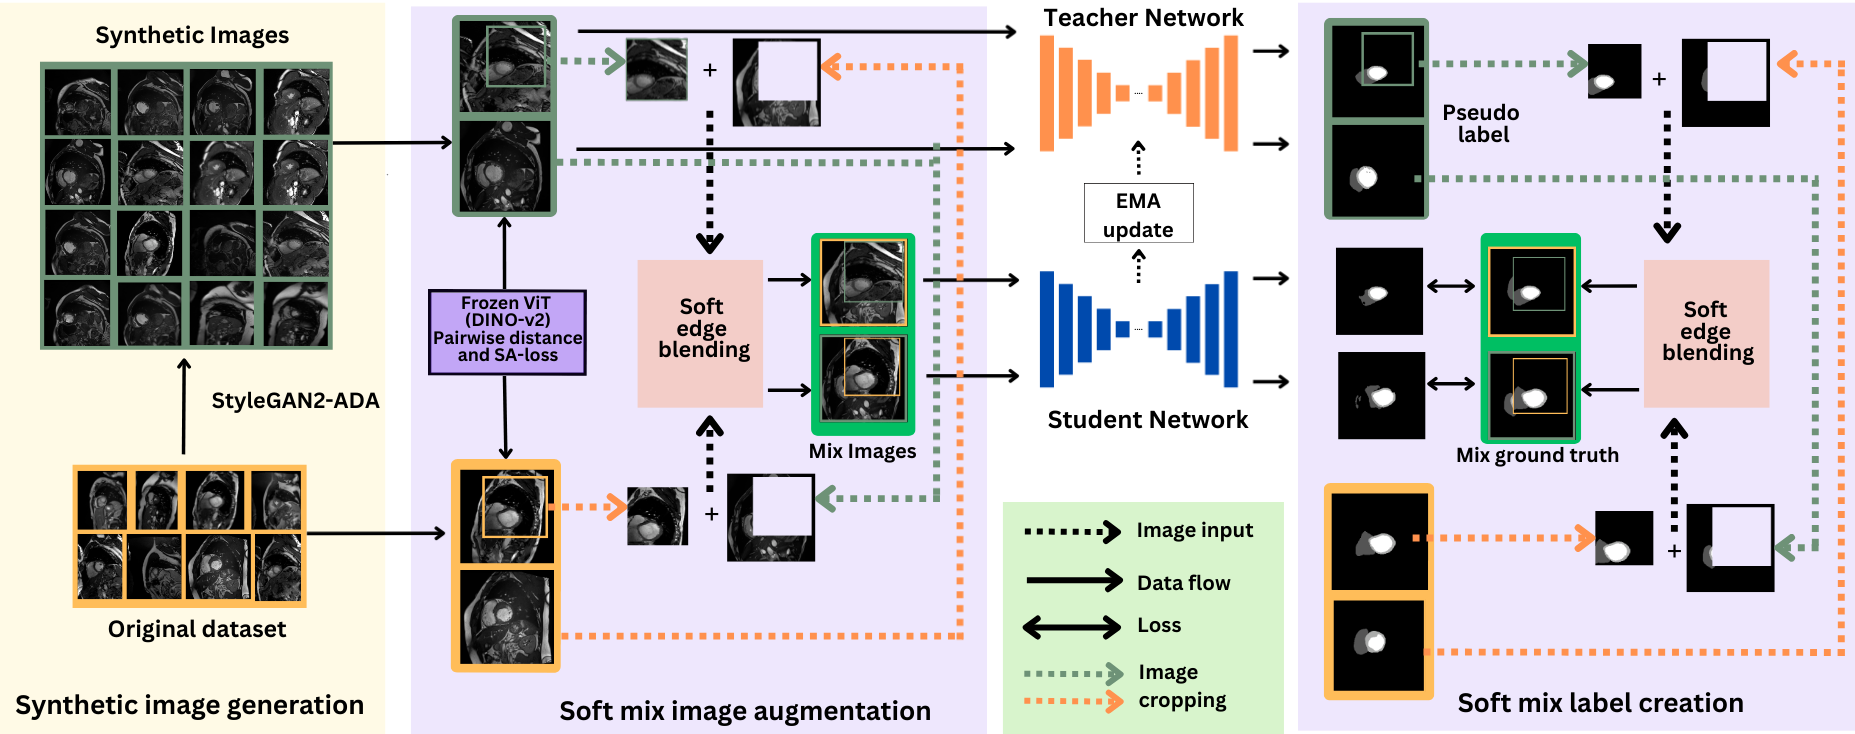
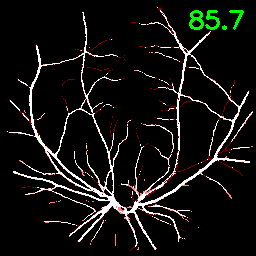
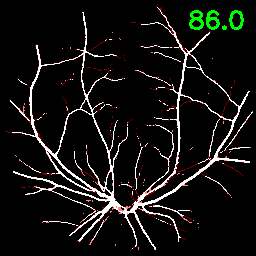
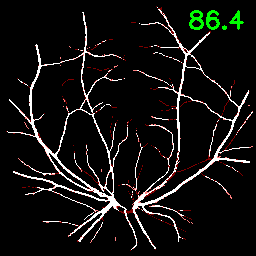
Synthetic data, an appealing alternative to extensive expert-annotated data for medical image segmentation, consistently fails to improve segmentation performance despite its visual realism. The reason being that synthetic and real medical images exist in different semantic feature spaces, creating a domain gap that current semi-supervised learning methods cannot bridge. We propose SRA-Seg, a framework explicitly designed to align synthetic and real feature distributions for medical image segmentation. SRA-Seg introduces a similarity-alignment (SA) loss using frozen DINOv2 embeddings to pull synthetic representations toward their nearest real counterparts in semantic space. We employ soft edge blending to create smooth anatomical transitions and continuous labels, eliminating the hard boundaries from traditional copy-paste augmentation. The framework generates pseudo-labels for synthetic images via an EMA teacher model and applies soft-segmentation losses that respect uncertainty in mixed regions. Our experiments demonstrate strong results: using only 10% labeled real data and 90% synthetic unlabeled data, SRA-Seg achieves 89.34% Dice on ACDC and 84.42% on FIVES, significantly outperforming existing semi-supervised methods and matching the performance of methods using real unlabeled data.
Key Contributions
- A framework explicitly designed to bridge the synthetic-to-real domain gap for semi-supervised medical image segmentation
- A similarity-alignment (SA) loss using frozen DINOv2 embeddings to pull synthetic features toward real counterparts
- Soft edge blending for smooth anatomical transitions, replacing hard copy-paste boundaries
Method
Synthetic Data Generation
High-fidelity synthetic images are generated using StyleGAN2-ADA trained on limited real labeled data (5% or 10%).
Soft-Mix Augmentation
Bidirectional patch exchange with soft edge blending creates smooth anatomical transitions, avoiding sharp boundaries.
Similarity-Alignment Loss
SA loss using frozen DINOv2 embeddings pulls synthetic features toward their nearest real counterparts in semantic space.
Soft-Segmentation Loss
Soft Dice and Cross-Entropy losses computed directly on continuous probability maps, respecting uncertainty in mixed regions.
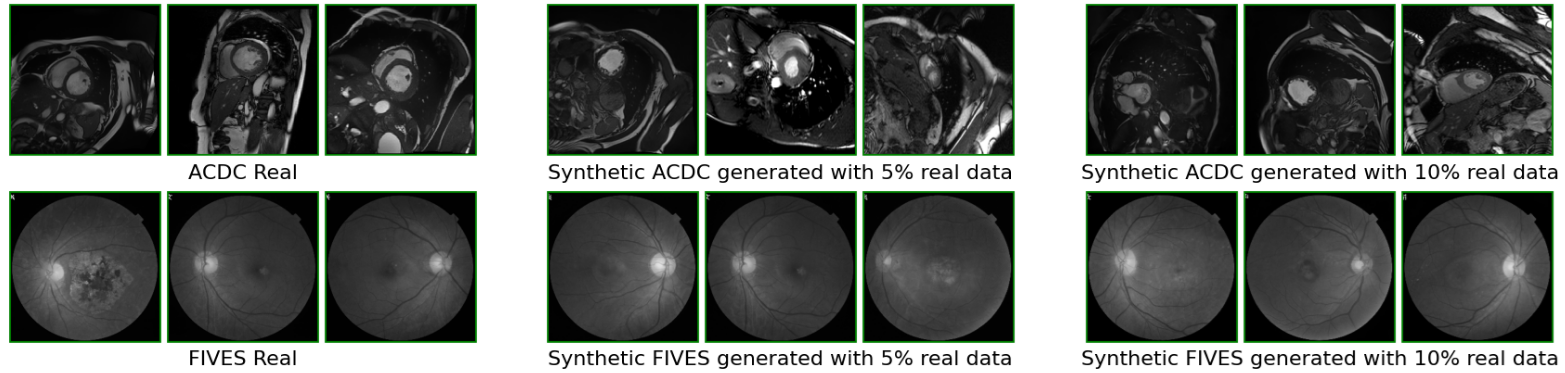
Figure: Synthetic data generated by StyleGAN2-ADA for ACDC (top) and FIVES (bottom) datasets. Left to right: first 3 are original images, next 3 generated using 5% real data, last 3 using 10% real data.
Domain Gap Visualization
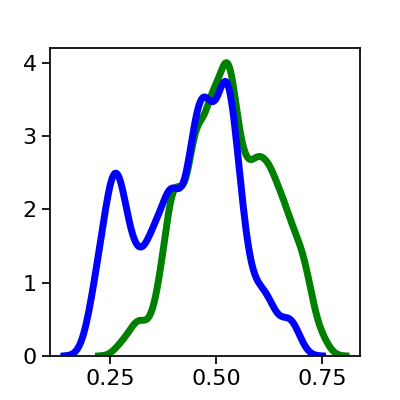
(a) UNet + Real Unlabeled
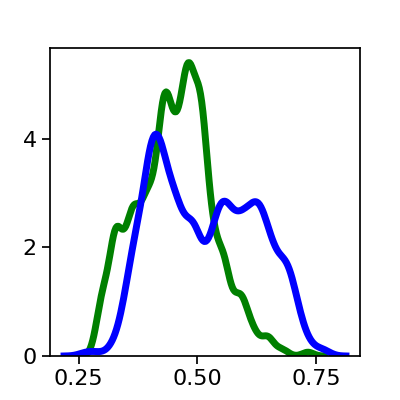
(b) UNet + Synthetic
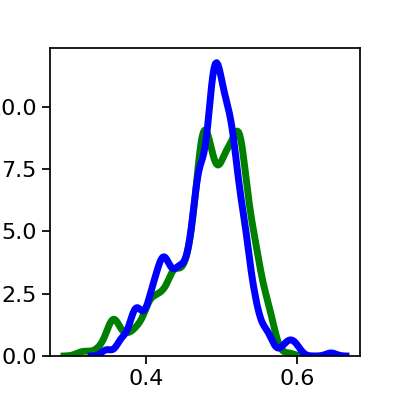
(c) BCP + Synthetic
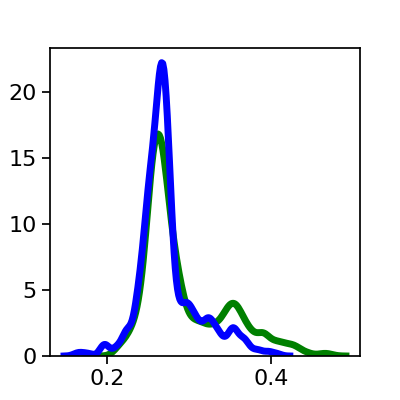
(d) SRA-Seg (Ours)
Figure: KDE plots showing domain mismatch between labeled (green) and unlabeled (blue) data. Our method (d) effectively aligns the distributions.
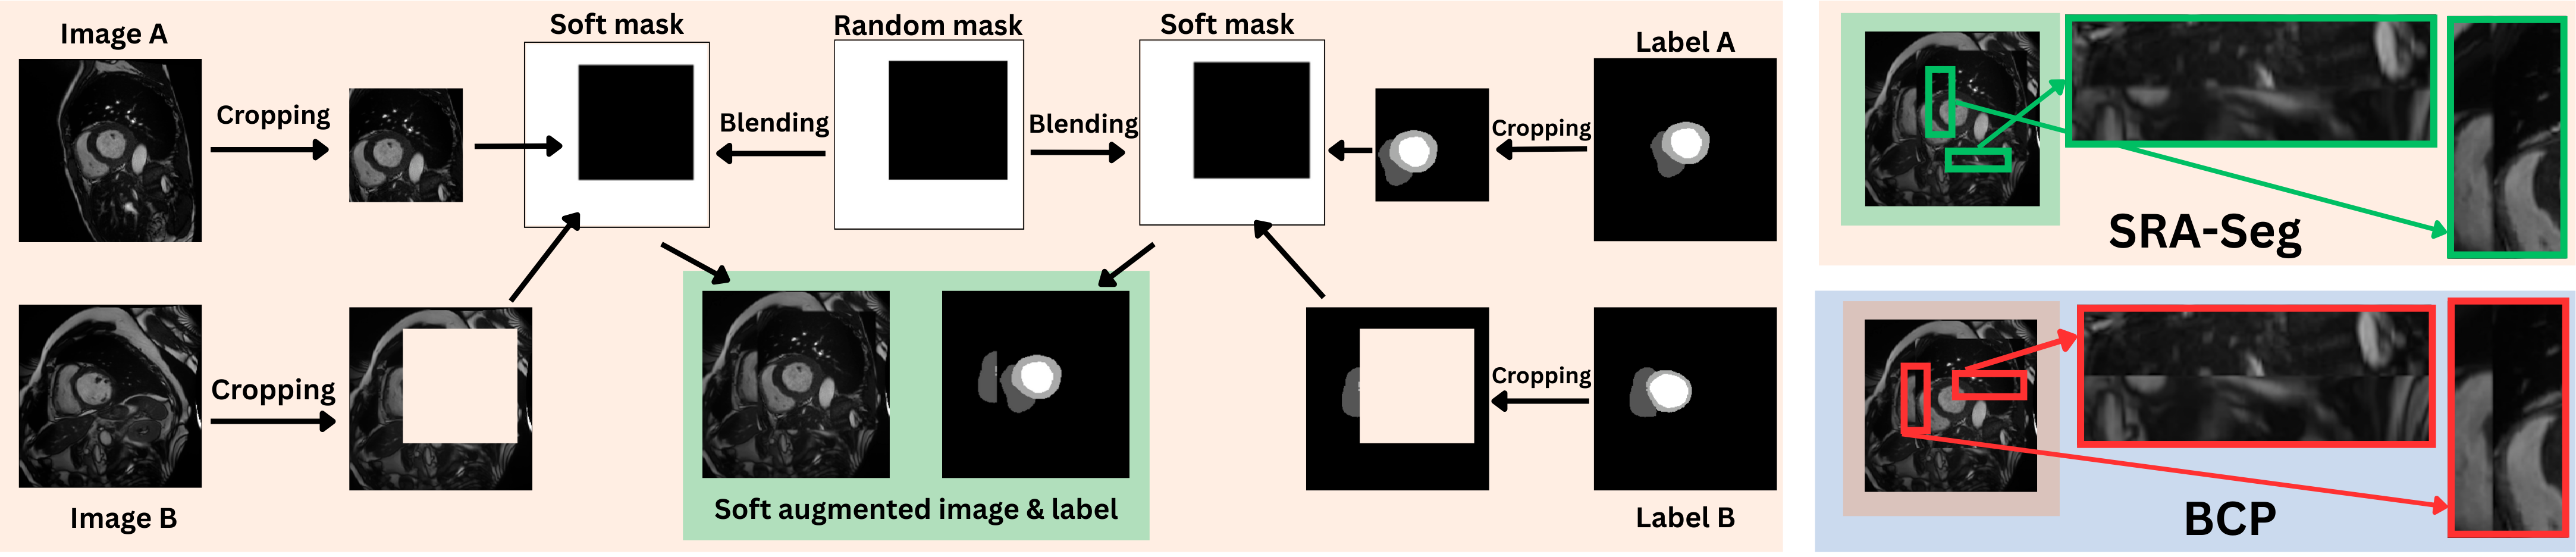
Figure: Soft Edge Blending component of SRA-Seg. The labeled and unlabeled images as well as the corresponding segmentation masks are mixed through cropping and soft mask blending to reduce sharp edges.
Results
ACDC Dataset (Cardiac MRI)
| Method | Labeled | Real Unlabeled | Synthetic | DICE ↑ | Jaccard ↑ | 95HD ↓ | ASD ↓ |
|---|---|---|---|---|---|---|---|
| 5% labeled | |||||||
| UNet | 68 | 0 | 0 | 47.83 | 37.01 | 31.16 | 12.62 |
| BCP (CVPR'23) | 68 (5%) | 1244 (95%) | 0 | 87.59 | 78.67 | 1.90 | 0.67 |
| SRA-Seg (Ours) | 68 (5%) | 1244 (95%) | 0 | 87.62 | 78.68 | 2.01 | 0.64 |
| BCP (CVPR'23) | 68 (5%) | 0 | 1244 (95%) | 54.64 | 41.20 | 15.78 | 4.83 |
| CrossMatch (JBHI'25) | 68 (5%) | 0 | 1244 (95%) | 9.80 | 6.67 | 377.99 | 75.15 |
| ABD(BCP) (CVPR'24) | 68 (5%) | 0 | 1244 (95%) | 21.84 | 14.83 | 10.26 | 1.87 |
| DiffRect (MICCAI'24) | 68 (5%) | 0 | 1244 (95%) | 63.74 | 53.51 | 19.29 | 6.13 |
| CGS (TMI'25) | 68 (5%) | 0 | 1244 (95%) | 29.23 | 18.93 | 19.20 | 6.23 |
| SRA-Seg (Ours) | 68 (5%) | 0 | 1244 (95%) | 60.02 | 46.52 | 19.95 | 5.83 |
| 10% labeled | |||||||
| UNet | 136 | 0 | 0 | 79.41 | 68.11 | 9.35 | 2.70 |
| BCP (CVPR'23) | 136 (10%) | 1176 (90%) | 0 | 88.84 | 80.62 | 3.98 | 1.17 |
| SRA-Seg (Ours) | 136 (10%) | 1176 (90%) | 0 | 88.99 | 81.00 | 2.82 | 0.83 |
| BCP (CVPR'23) | 136 (10%) | 0 | 1176 (90%) | 87.46 | 78.53 | 5.30 | 1.62 |
| CrossMatch (JBHI'25) | 136 (10%) | 0 | 1176 (90%) | 85.26 | 76.28 | 3.72 | 1.00 |
| ABD(BCP) (CVPR'24) | 136 (10%) | 0 | 1176 (90%) | 87.03 | 77.88 | 3.19 | 0.85 |
| DiffRect (MICCAI'24) | 136 (10%) | 0 | 1176 (90%) | 88.14 | 79.65 | 5.72 | 1.60 |
| CGS (TMI'25) | 136 (10%) | 0 | 1176 (90%) | 87.76 | 78.95 | 3.82 | 1.31 |
| SRA-Seg (Ours) | 136 (10%) | 0 | 1176 (90%) | 89.34 | 81.24 | 3.03 | 1.14 |
Bold is best and underline is second best, ranked within the synthetic-unlabeled block of each split. The real-unlabeled rows are reference upper bounds and are not ranked.
FIVES Dataset (Fundus Images)
| Method | Labeled | Real Unlabeled | Synthetic | DICE ↑ | Jaccard ↑ | 95HD ↓ | ASD ↓ |
|---|---|---|---|---|---|---|---|
| 5% labeled | |||||||
| UNet | 28 | 0 | 0 | 49.50 | 34.38 | 18.03 | 3.55 |
| BCP (CVPR'23) | 28 (5%) | 532 (95%) | 0 | 80.39 | 67.29 | 2.09 | 0.15 |
| SRA-Seg (Ours) | 28 (5%) | 532 (95%) | 0 | 81.23 | 68.46 | 2.07 | 0.13 |
| BCP (CVPR'23) | 28 (5%) | 0 | 532 (95%) | 82.34 | 70.05 | 1.76 | 0.17 |
| CrossMatch (JBHI'25) | 28 (5%) | 0 | 532 (95%) | 62.24 | 45.47 | 3.95 | 0.03 |
| ABD(BCP) (CVPR'24) | 28 (5%) | 0 | 532 (95%) | 70.61 | 54.00 | 3.28 | 0.14 |
| DiffRect (MICCAI'24) | 28 (5%) | 0 | 532 (95%) | 82.79 | 70.69 | 1.56 | 0.23 |
| CGS (TMI'25) | 28 (5%) | 0 | 532 (95%) | 81.14 | 68.38 | 1.84 | 0.20 |
| SRA-Seg (Ours) | 28 (5%) | 0 | 532 (95%) | 82.85 | 70.78 | 1.72 | 0.15 |
| 10% labeled | |||||||
| UNet | 56 | 0 | 0 | 59.36 | 43.71 | 13.69 | 2.46 |
| BCP (CVPR'23) | 56 (10%) | 504 (90%) | 0 | 81.87 | 69.35 | 1.85 | 0.15 |
| SRA-Seg (Ours) | 56 (10%) | 504 (90%) | 0 | 82.58 | 70.38 | 1.80 | 0.16 |
| BCP (CVPR'23) | 56 (10%) | 0 | 504 (90%) | 83.86 | 72.25 | 1.51 | 0.17 |
| CrossMatch (JBHI'25) | 56 (10%) | 0 | 504 (90%) | 60.68 | 43.73 | 3.69 | 0.02 |
| ABD(BCP) (CVPR'24) | 56 (10%) | 0 | 504 (90%) | 63.53 | 46.76 | 6.37 | 2.46 |
| DiffRect (MICCAI'24) | 56 (10%) | 0 | 504 (90%) | 84.22 | 72.79 | 1.41 | 0.16 |
| CGS (TMI'25) | 56 (10%) | 0 | 504 (90%) | 83.55 | 71.80 | 1.59 | 0.17 |
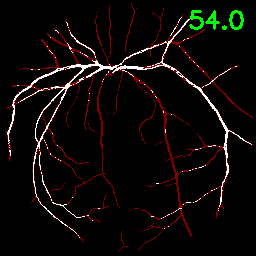
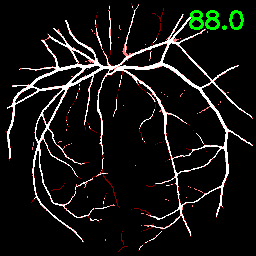
| SRA-Seg (Ours) | 56 (10%) | 0 | 504 (90%) | 84.42 | 73.08 | 1.34 | 0.16 |
Bold is best and underline is second best, ranked within the synthetic-unlabeled block of each split. The real-unlabeled rows are reference upper bounds and are not ranked.
Qualitative Results
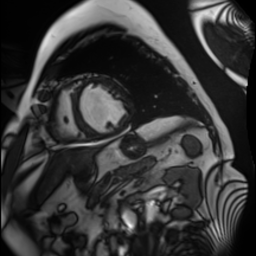
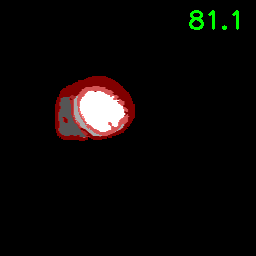
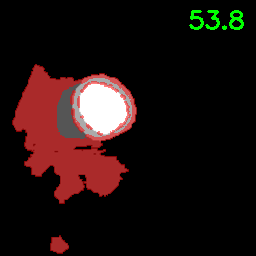
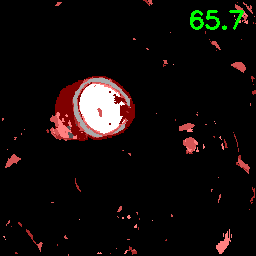
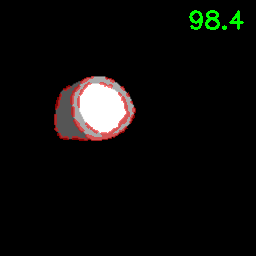
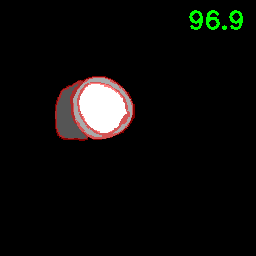
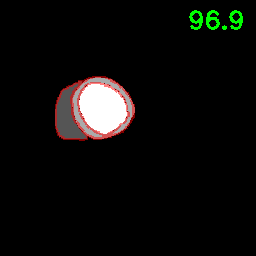
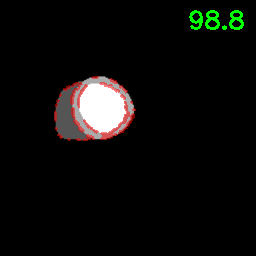
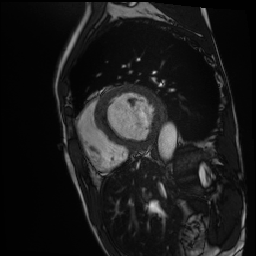
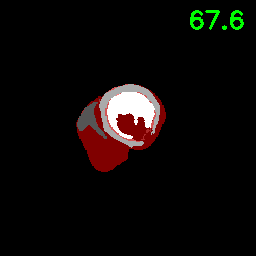
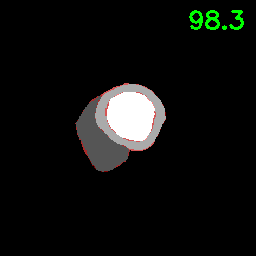
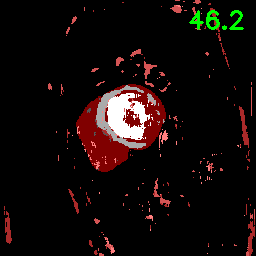
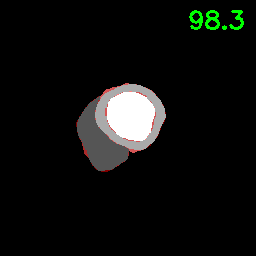
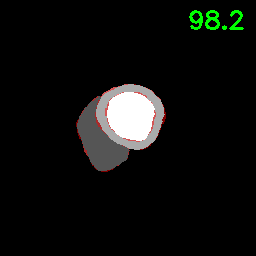
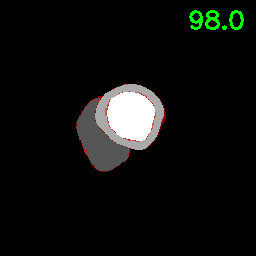
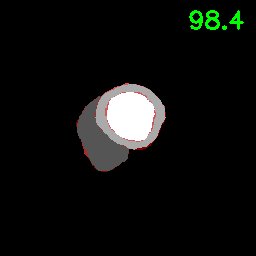
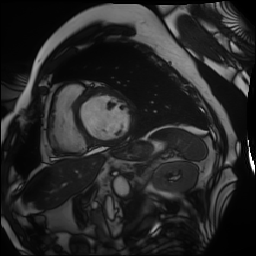
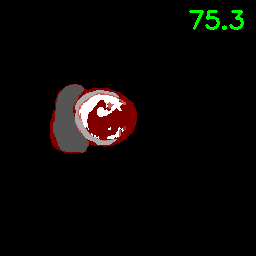
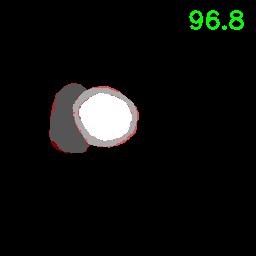
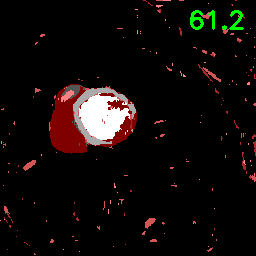
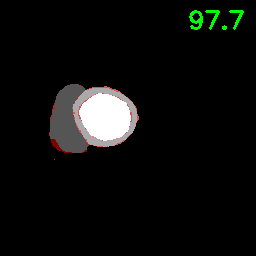
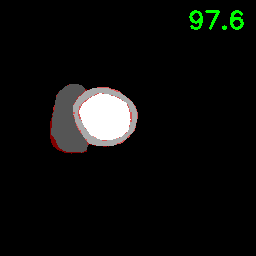
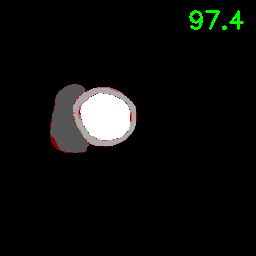
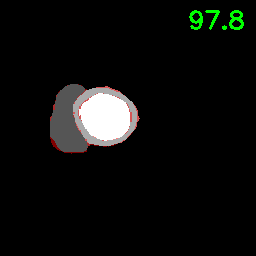
ACDC Dataset (10% labeled, 90% synthetic). Incorrectly segmented pixels are highlighted in red. Click any image to enlarge.
| Image | UNet | BCP | CrossMatch | ABD | DiffRect | CGS | SRA-Seg | GT |
|---|---|---|---|---|---|---|---|---|
 |
 |
 |
 |
 |
 |
 |
 |
 |
 |
 |
 |
 |
 |
 |
 |
 |
 |
 |
 |
 |
 |
 |
 |
 |
 |
 |
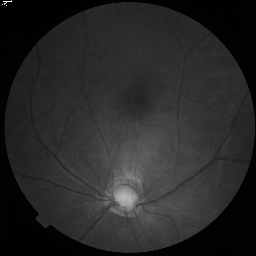
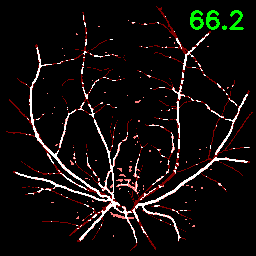
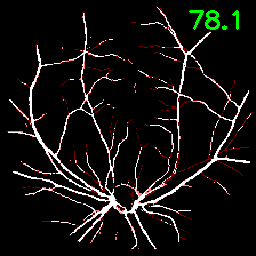
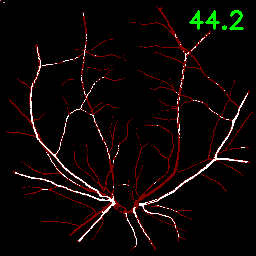
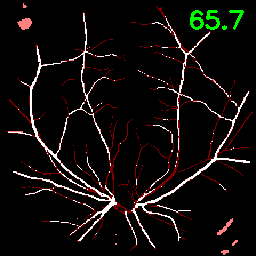
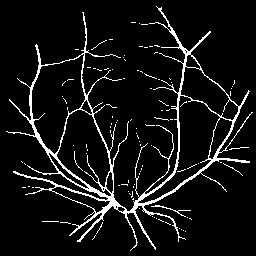
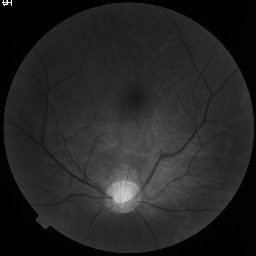
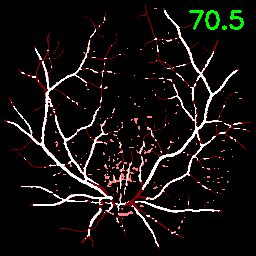
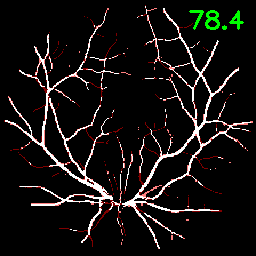
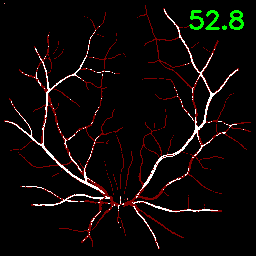
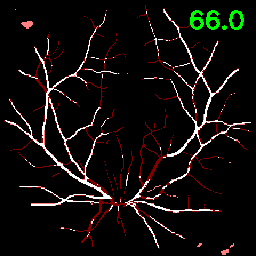
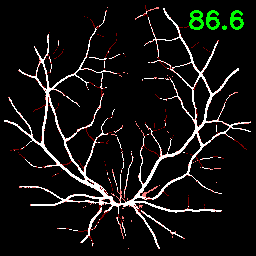
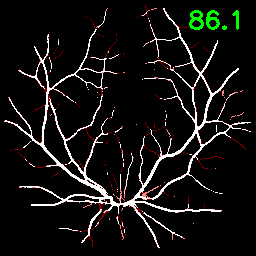
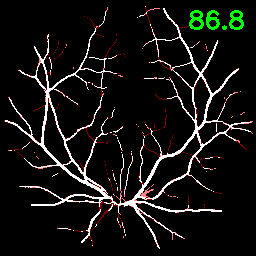
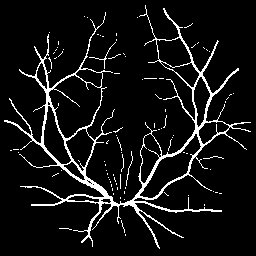
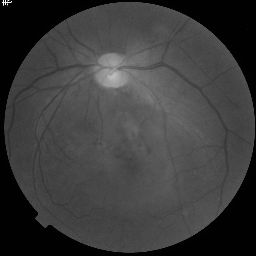
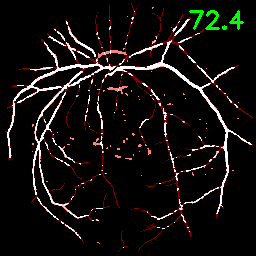
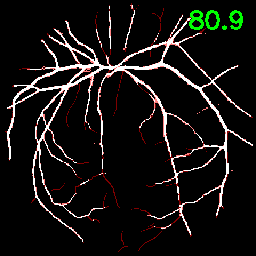
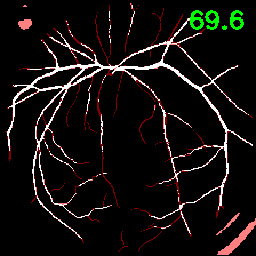
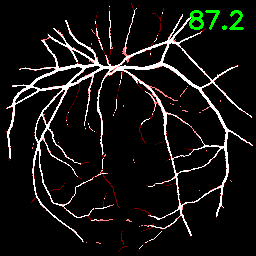
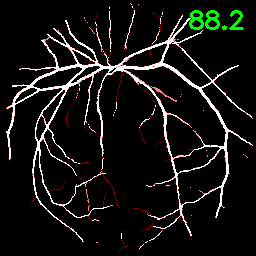
FIVES Dataset (10% labeled, 90% synthetic). Incorrectly segmented pixels are highlighted in red. Click any image to enlarge.
| Image | UNet | BCP | CrossMatch | ABD | DiffRect | CGS | SRA-Seg | GT |
|---|---|---|---|---|---|---|---|---|
 |
 |
 |
 |
 |
 |
 |
 |
 |
 |
 |
 |
 |
 |
 |
 |
 |
 |
 |
 |
 |
 |
 |
 |
 |
 |
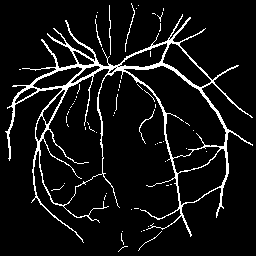 |
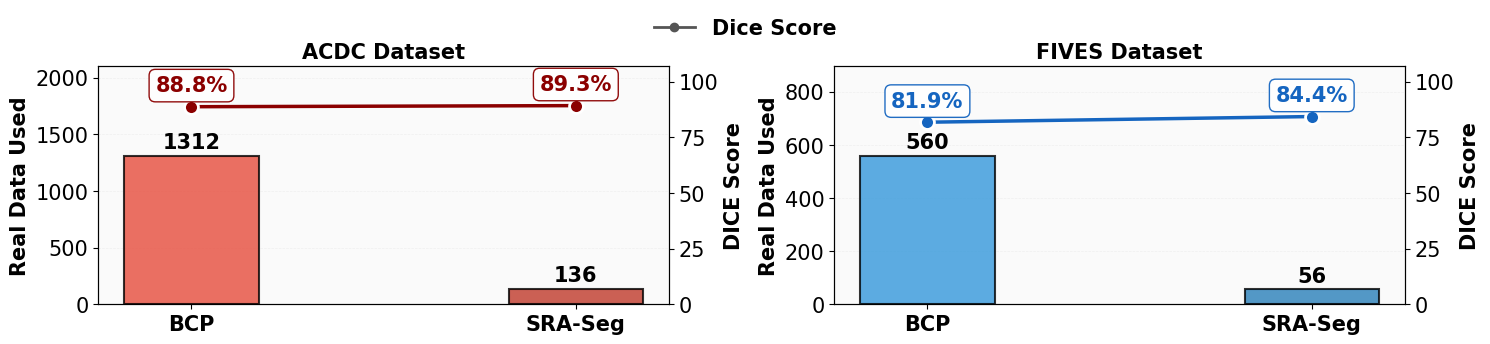
Figure: Comparison of real-image usage (bar height) and resulting Dice scores (red markers) for BCP versus SRA-Seg on ACDC and FIVES datasets. SRA-Seg achieves higher Dice with only 10% real data.
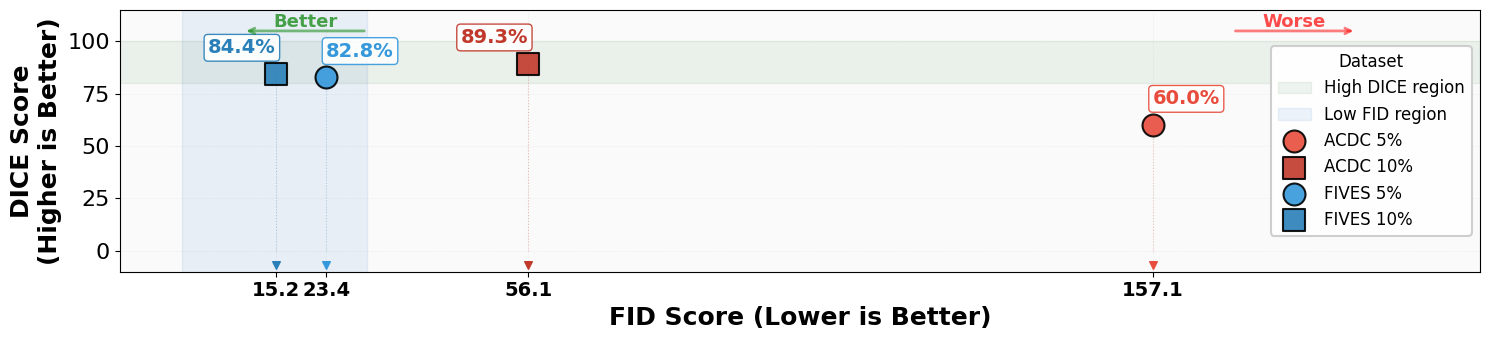
Figure: FID scores comparing synthetic and real images across 5% and 10% data splits. Lower FID indicates better synthetic data quality. FIVES achieves consistently lower FID scores.
Ablation Study
All configurations use 10% real labeled and 90% synthetic unlabeled data. The first row is the BCP baseline.
| Soft-mix | Soft-loss | SA-loss | ACDC DICE ↑ | ACDC Jaccard ↑ | ACDC 95HD ↓ | ACDC ASD ↓ | FIVES DICE ↑ | FIVES Jaccard ↑ | FIVES 95HD ↓ | FIVES ASD ↓ |
|---|---|---|---|---|---|---|---|---|---|---|
| ✗ | ✗ | ✗ | 87.46 | 78.53 | 5.30 | 1.62 | 83.86 | 72.25 | 1.51 | 0.17 |
| ✗ | ✗ | ✓ | 87.60 | 78.66 | 9.66 | 2.75 | 84.02 | 72.50 | 1.51 | 0.16 |
| ✓ | ✗ | ✗ | 88.16 | 79.42 | 4.80 | 1.50 | 84.08 | 72.58 | 1.54 | 0.17 |
| ✓ | ✗ | ✓ | 88.09 | 79.36 | 2.14 | 0.78 | 84.25 | 72.83 | 1.44 | 0.16 |
| ✓ | ✓ | ✗ | 88.96 | 80.69 | 2.87 | 1.01 | 84.16 | 72.71 | 1.51 | 0.16 |
| ✓ | ✓ | ✓ | 89.33 | 81.25 | 2.94 | 0.85 | 84.42 | 73.08 | 1.34 | 0.16 |
Bold is best per metric. Soft-mix and soft-loss together give the largest Dice gain; SA-loss adds the final improvement and is what closes the distribution gap shown in the KDE plots.
BibTeX
@InProceedings{aranya2027sraseg,
  author    = {Aranya, OFM Riaz Rahman and Desai, Kevin},
  title     = {SRA-Seg: Synthetic to Real Alignment for Semi-Supervised Medical Image Segmentation},
  booktitle = {Pattern Recognition (ICPR)},
  publisher = {Springer Nature Switzerland},
  address   = {Cham},
  pages     = {698--715},
  year      = {2027},
  doi       = {10.1007/978-3-032-31335-5_47},
  isbn      = {978-3-032-31335-5}
}
Acknowledgments
This work builds upon BCP and utilizes StyleGAN2-ADA for synthetic data generation and DINOv2 for feature extraction.